Short, sourced reads and primers on the economy, markets, and finance from MCS Advisory and CatalystIQ. Published on the record, dated, and cited to primary data. Not investment advice.
September 15, 2026
Does Growth Cause Inflation?
No. Growth is more goods. Inflation is more money. History has run the experiment several times.
Click to view full size.
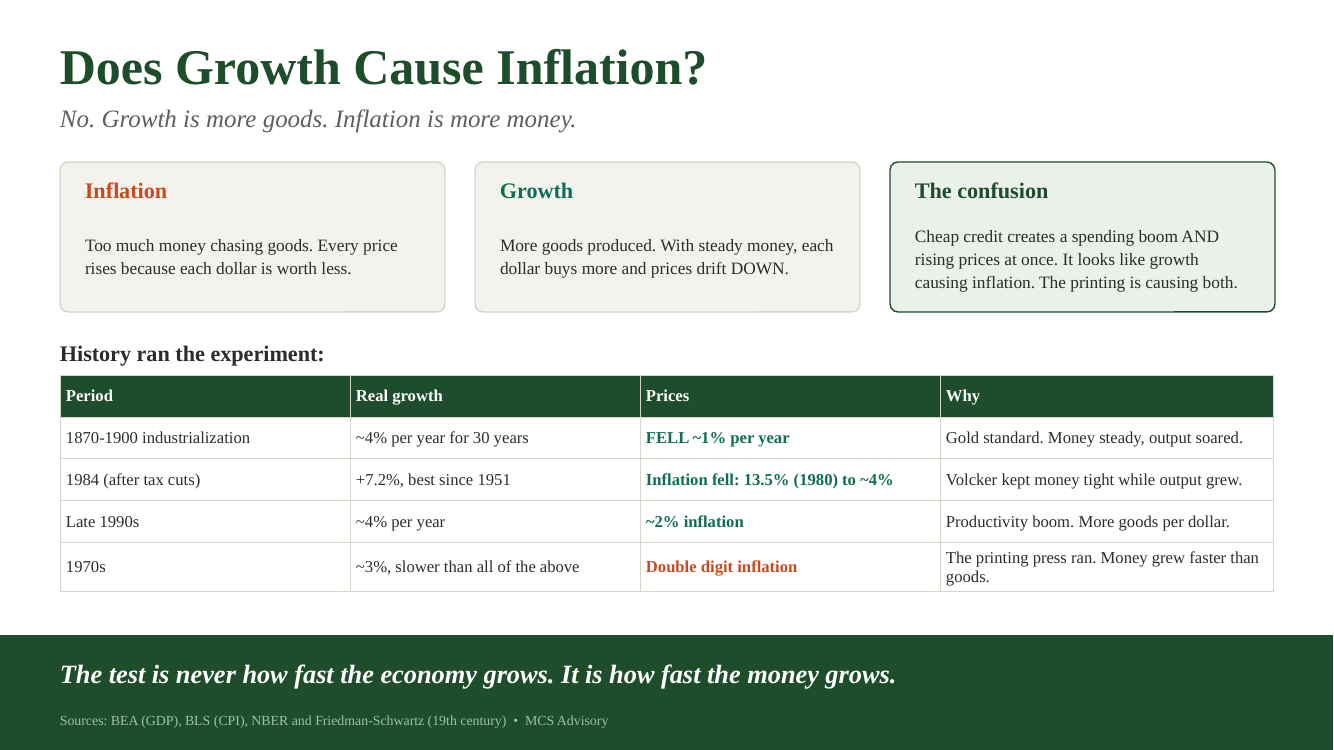
Does a growing economy cause inflation? No. Start with two definitions. Inflation is too much money chasing goods. Growth is more goods. If the amount of money holds steady while the economy produces more, each dollar buys more, and prices drift down, not up.
History ran this experiment. From 1870 to 1900 the United States industrialized at roughly 4% real growth a year, among the fastest stretches in its history, while consumer prices fell about 1% a year. Fast growth, falling prices, for three decades.
So why do so many believe growth causes inflation? Because of what artificial booms travel with. When a central bank holds interest rates artificially low, borrowed money floods the economy. Spending surges past what the economy can produce, and prices rise. It looks like growth causing inflation. It is actually money creation causing both the boom and the inflation at the same time.
The difference shows up in the record. In 1984 the economy grew 7.2%, the best year since 1951, while inflation fell from 13.5% in 1980 to near 4%. The late 1990s produced roughly 4% growth with 2% inflation on a productivity boom. The 1970s grew more slowly than any of those periods, with double digit inflation, because money grew faster than goods.
Real growth means more goods, and more goods push prices down. The test is never how fast the economy grows. It is how fast the money grows.
Sources: BEA (GDP); BLS (CPI); NBER and Friedman-Schwartz, A Monetary History of the United States (19th-century data).
Where the New Barrels Come From: October 2026 to March 2027
Relief supply is arriving. None of it is local, and the government's own forecast says the diesel premium outlives the war.
Click to view full size.
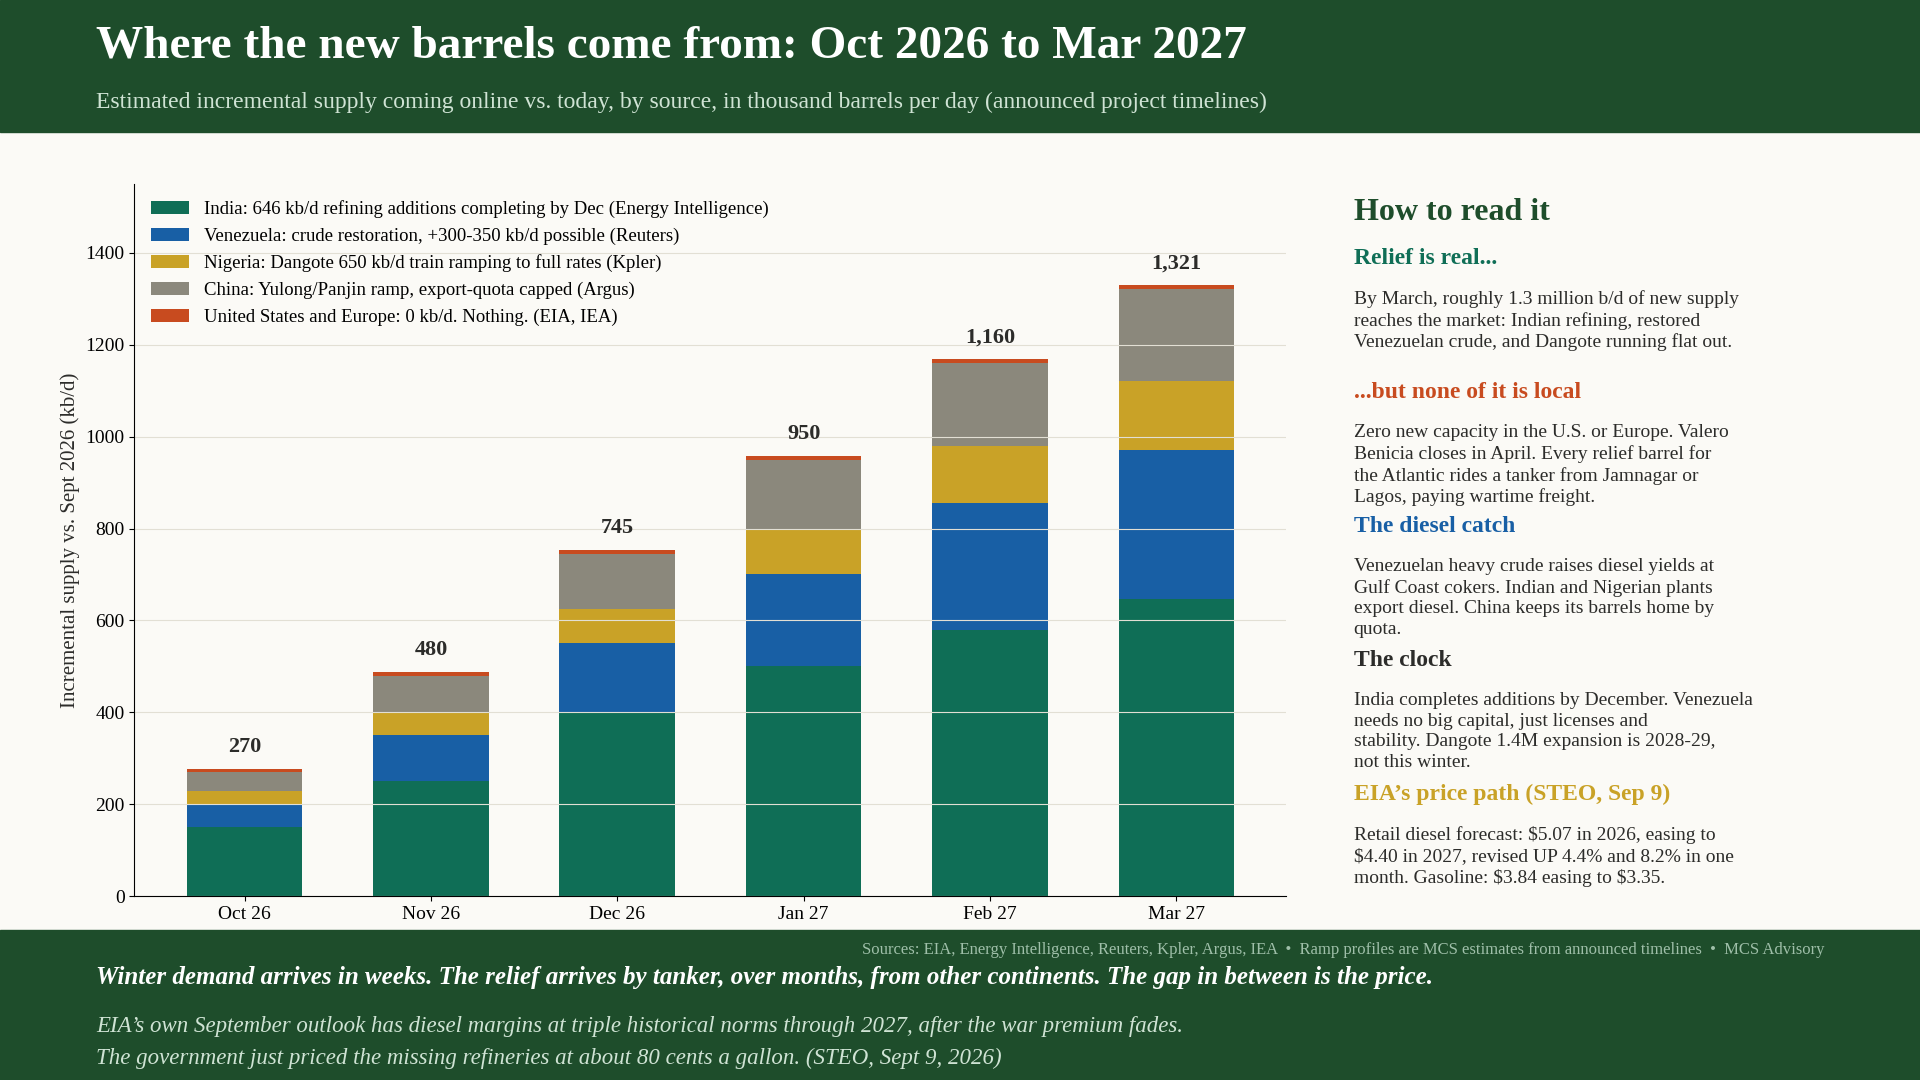
By March, roughly 1.3 million barrels per day of incremental supply reaches the market. India completes 646,000 b/d of refining additions in its current fiscal year, with the diesel-heavy HPCL Rajasthan greenfield already producing. Venezuela's crude restoration can add 300,000 to 350,000 b/d with minimal capital, and its heavy grade raises diesel yields at U.S. Gulf Coast cokers. Nigeria's Dangote refinery, the largest single-train plant in the world, continues ramping toward its full 650,000 b/d. China's new capacity ramps as well, but export quotas keep those barrels largely at home.
The amount of this new capacity located in the United States or Europe is zero. Valero's Benicia refinery closes in April 2027, continuing a trend that has removed 1.2 million b/d of U.S. refining capacity since 2019 and roughly 3.8 million b/d worldwide. Every relief barrel bound for the Atlantic travels by tanker from another continent.
The EIA's September Short-Term Energy Outlook quantifies the consequence. It forecasts retail diesel averaging $5.07 per gallon in 2026, easing to $4.40 in 2027, and it revised both figures upward in a single month. Its distillate margin forecast, $1.57 per gallon in 2026 and $1.25 in 2027 against a historical norm of roughly 30 to 50 cents, holds diesel refining margins near triple historical levels through 2027, after the war premium fades.
Winter demand arrives in weeks. The relief arrives by tanker, over months, from other continents. The gap in between is the price.
Sources: EIA Short-Term Energy Outlook (Sept 9, 2026); EIA Weekly Petroleum Status Report; Energy Intelligence; Reuters; Kpler; Argus; IEA. Monthly ramp profiles are MCS estimates interpolated from announced project timelines.
September 11, 2026
The Diesel Squeeze: What This Week's EIA Report Actually Says
Refineries at full throttle, inventories at multi-decade seasonal lows, and no strategic reserve behind them.
Click to view full size.
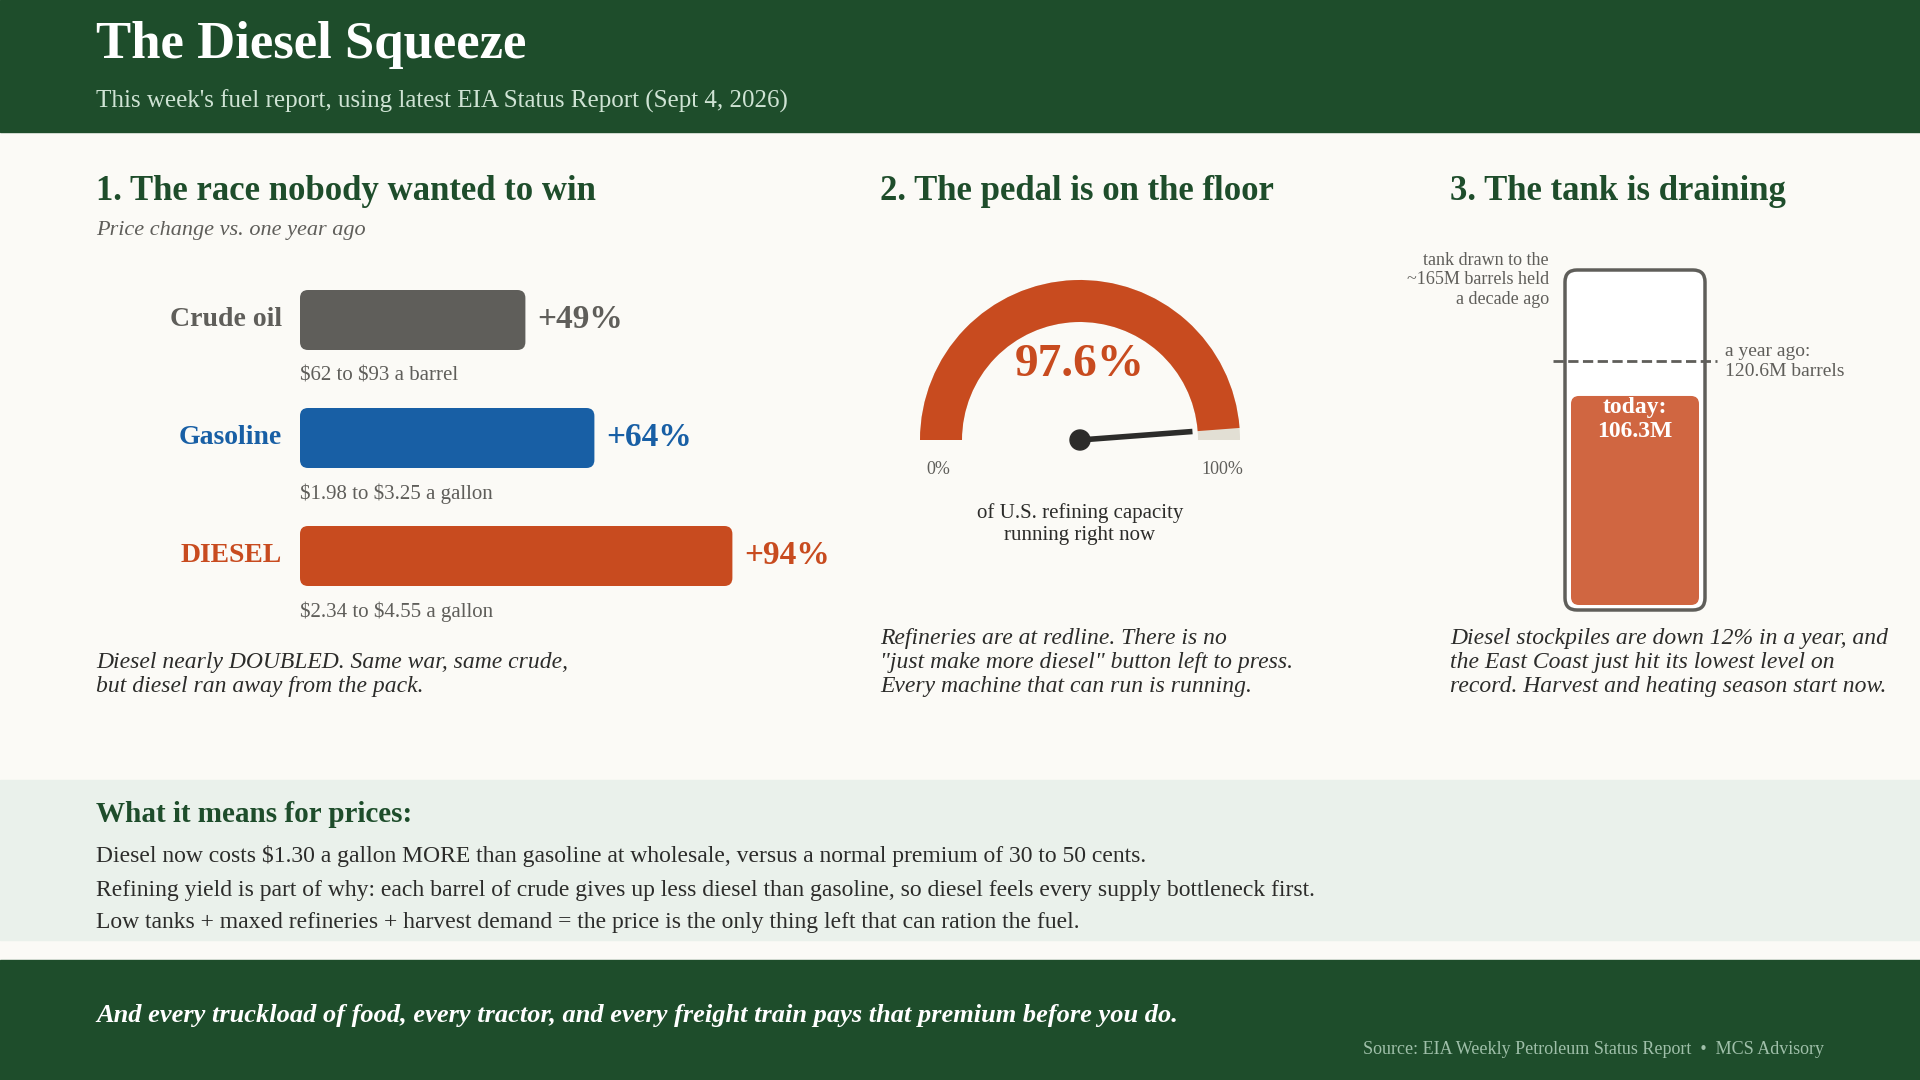
U.S. refineries are running at 97.6% of capacity. The country produces 5.2 million barrels of distillate per day and consumes 3.7 million; the balance is exported into a tight global market. Distillate inventories stand at 106.3 million barrels, down 12% from a year ago, equal to about 29 days of U.S. consumption, and at multi-decade lows for this time of year. On the East Coast, inventories reached their lowest level in records going back to 1990.
Those inventories are working stock, fuel in motion between refineries, pipelines, and terminals, not a reserve. The only government-held diesel reserve is the Northeast Home Heating Oil Reserve: 1 million barrels, roughly six hours of national consumption. The Strategic Petroleum Reserve holds crude oil, not refined fuel, and with utilization near maximum there is little spare capacity to refine additional crude in a disruption.
The price record reflects the imbalance. Since the start of the year, retail diesel has risen 94% year over year against 64% for gasoline, and diesel's wholesale premium over gasoline has widened to roughly $1.30 per gallon against a normal premium of 30 to 50 cents. Because each barrel of crude yields a fixed share of diesel, roughly 27%, refiners cannot meaningfully shift output toward the short product.
Near-maximum utilization, multi-decade seasonal inventory lows, and no stock buffer: the system has little capacity to absorb a further supply disruption without price doing the adjustment.
Sources: EIA Weekly Petroleum Status Report, week ending September 4, 2026; EIA Refinery Capacity Report (June 2026); U.S. Department of Energy (Northeast Home Heating Oil Reserve).
ABOUT THESE NOTES. Market Insights are dated commentary from MCS Advisory and CatalystIQ, written for general information and education. They are cited to primary sources, primarily U.S. government data, and reflect conditions as of the date shown. Nothing here is investment, legal, or tax advice, and nothing constitutes a recommendation to buy or sell any security or commodity. For engagement inquiries, request a confidential conversation.